Automobile Depreciation Calculator Estimate Vehicle Depreciation
Recent Auto Loan Rates
We publish an auto lender review guide to help buyers see current rates from top nationwide lenders.
For your convenience, here is data on what rates looked like across Q1 of 2023 after the Federal Reserve likely completed most of the current hiking cycle.
| Borrower | Credit Score | New | Used |
|---|---|---|---|
| Super Prime | 781 - 850 | 5.18% | 6.79% |
| Prime | 661 - 780 | 6.40% | 8.75% |
| Nonprime | 601 - 660 | 8.86% | 13.28% |
| Subprime | 501 - 600 | 11.53% | 18.55% |
| Deep Subprime | 300 - 500 | 14.08% | 21.32% |
Source: Experian 2023 Q1 data
Here were what rates looked like in Q2 of 2022.
| Borrower | Credit Score | New | Used |
|---|---|---|---|
| Super Prime | 781 - 850 | 2.96% | 3.68% |
| Prime | 661 - 780 | 4.03% | 5.53% |
| Nonprime | 601 - 660 | 6.57% | 10.33% |
| Subprime | 501 - 600 | 9.75% | 16.85% |
| Deep Subprime | 300 - 500 | 12.84% | 20.43% |
Source: Experian 2022 Q2 data, published in August of 2022
For historical comparison, here is what the data looked like in Q1 of 2020 as the COVID-19 crisis spread across the United States.
| Borrower | Credit Score | New | Used |
|---|---|---|---|
| Super Prime | 720 or higher | 3.65% | 4.29% |
| Prime | 660 - 719 | 4.68% | 6.04% |
| Nonprime | 620 - 659 | 7.65% | 11.26% |
| Subprime | 580 - 619 | 11.92% | 17.74% |
| Deep Subprime | 579 or lower | 14.39% | 20.45% |
Source: Experian 2020 Q1 data, published on August 16, 2020
Across the industry, on average automotive dealers make more money selling loans at inflated rates than they make from selling cars. Before you sign a loan agreement with a dealership you should contact a community credit union or bank and see how they compare. You can often save thousands of dollars by getting a quote from a trusted financial institution instead of going with the hard sell financing you will get at an auto dealership.
If our site helped you save time or money, please get your accessories like cell phone chargers, mounts, radar detectors and other such goodies from Amazon.com through our affiliate link to help support our site. Thank you!

Vehicle Depreciation Information
Different vehicles tend to depreciate at significantly different rates. Sports cars, for example, tend to depreciate rather rapidly, in part because they are presumed to have been driven aggressively & often require expensive maintenance sooner. Many work trucks do a much better job retaining value as the vehicles are required to do work as part of the job. Some luxury cars are highly coveted even when used, which in turn gives them a lower rate of depreciation & makes them relatively affordable to lease rather than buy.
The Best Time to Buy
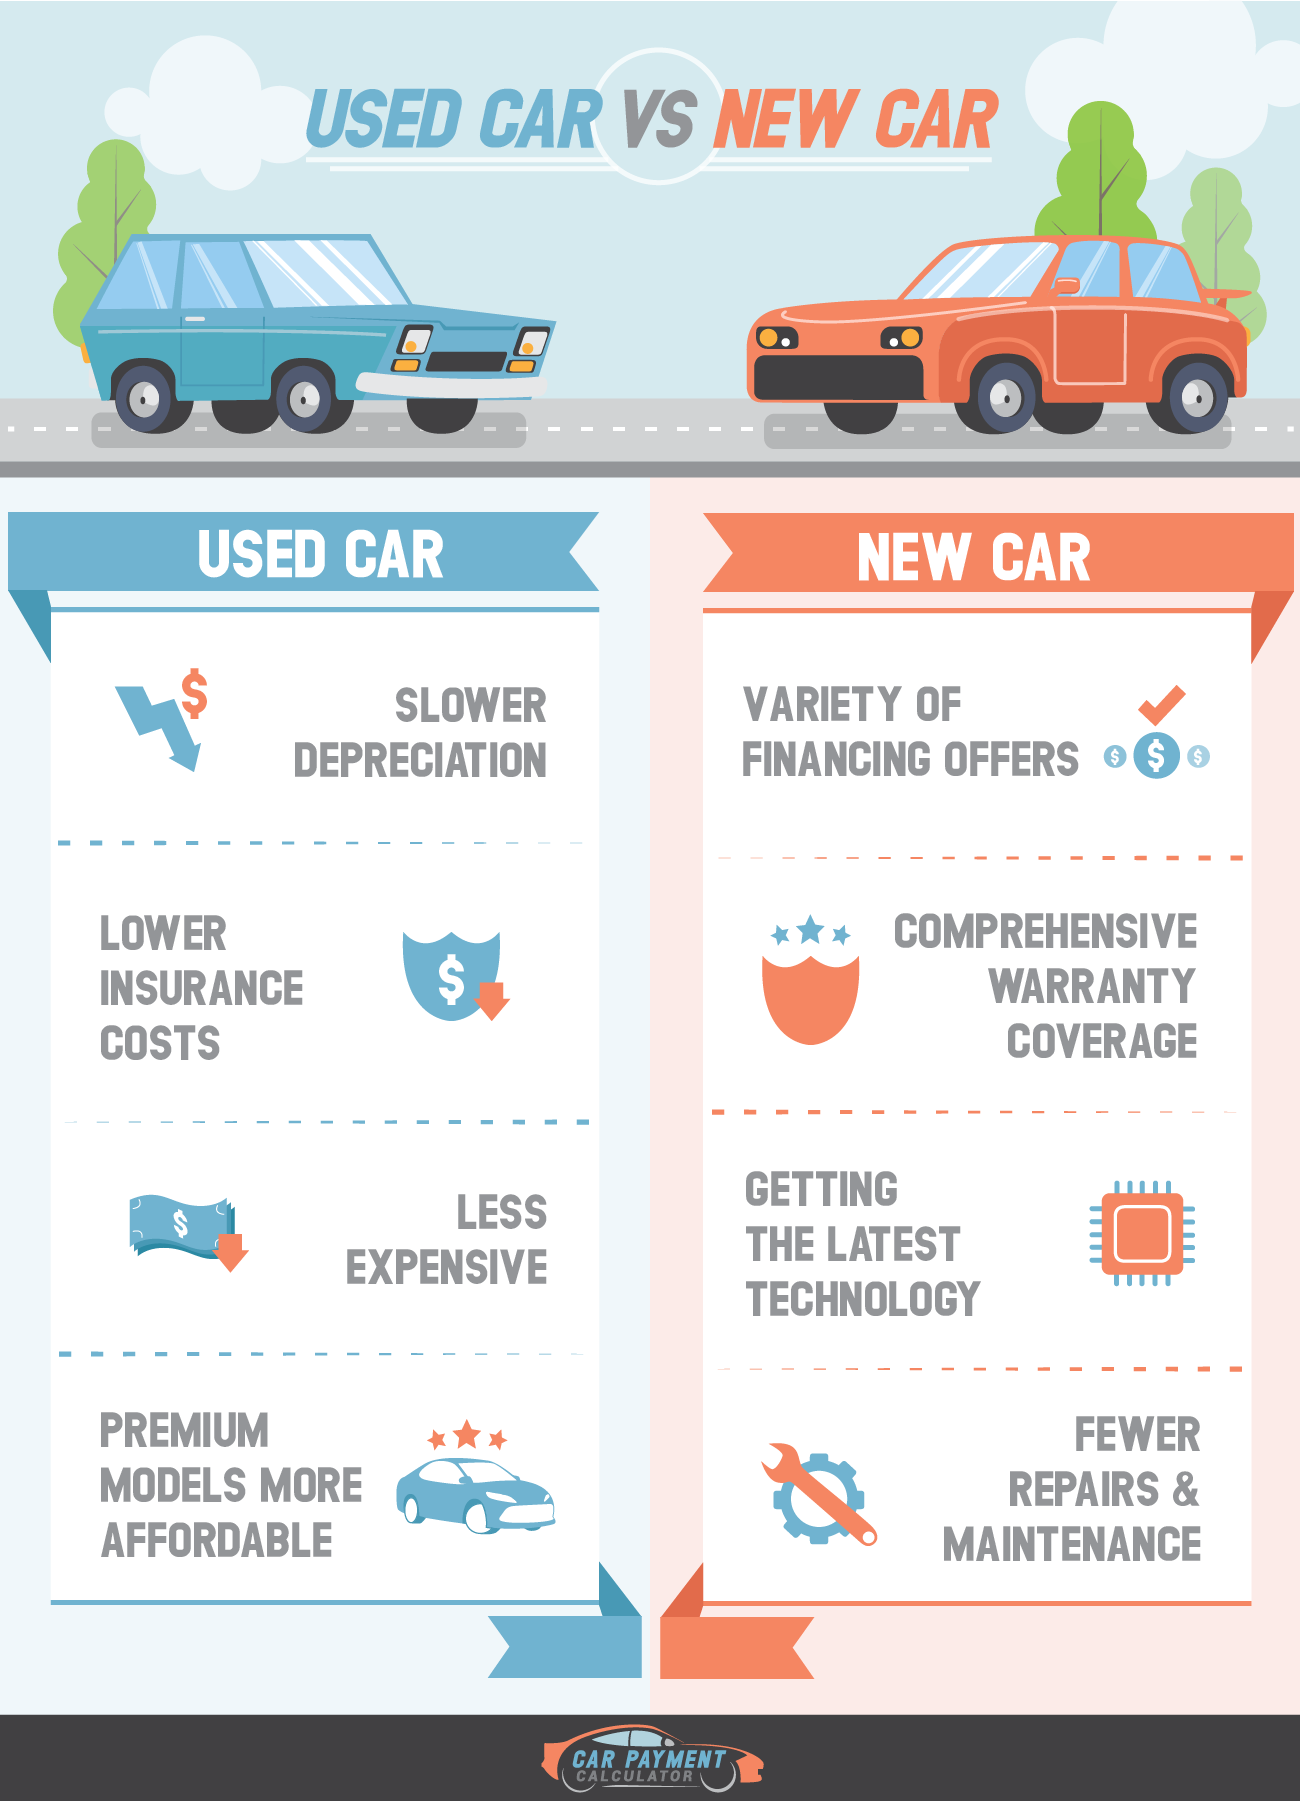
Between losses from driving off the lot & other depreciation in the first year many cars lose about a quarter of their value in the first year. The cost of depreciation tends to slow significantly in subsequent years, so if you can find a reliable car that is 1 or 2 years old it may offer a great value relative to eating the initial "drive off the lot" depreciation.
If you have taken care of your car then make sure you keep maintenance records to prove you've taken good care of the vehicle. If you are consider buying a vehicle and the price seems too good to be true make sure you use Carfax or AutoCheck. If you believe the car may have been involved in flooding, have it professionally inspected before buying.
Tax Time Buyers
Many consumers buy or lease new vehicles in March or April around when they file their state & federal income taxes. Generally speaking it is usually better to buy a new car when other shoppers are not aggressively buying them. If you are buying a used car off lease then there should be better selections & deals available shortly after other people have traded in for the latest model.
Year-end Deals
Some manufacturers offer deep discounts on new cars near the end of the year to make way for new models. If a model you want goes on sale & is something you intend to own for many years then that might be a great time of year to purchase. However, if you plan on selling the vehicle after only a year or two then getting the prior model may make the car feel relatively older than it is and have you eat more depreciation than you save through the manufacturer discounts & rebates.
Monthly & Quarterly Dealer Sales Volume Incentives
Some manufacturers offer dealerships bonuses based on their monthly or quarterly sales. In some cases dealerships will sell cars near break even to drive volume at the end of a month or end of a quarter to reach their volume-based sales bonuses.
Used Car Cycles & the Broader Economy

The used car market itself also has cycles to it. Used car values plummeted in 2008 & 2009.
After the Great Recession the United States Federal Government unveiled the Car Allowance Rebate System (CARS), which was colloquially known as the "cash for clunkers" program. The $3 billion incentive program caused many people to trade-in cars to buy or lease more fuel efficient new cars. The trade-in program retired a portion of the used car stock, which in turn lifted used car prices. Used car prices have been quite stable from the middle of 2011 through most of 2016. The demand pulled forward from the CARS program now has a glut of people trading in cars, which has pushed down trade-in values as dealers have expanded their margins on used cars.
Used car prices impact every aspect of the auto market, as the residual value of used cars determines the rate at which carmakers can lease new cars for & how much they can charge for new cars. In the first quarter of 2017 leases made up 31.06% of consumer sales. As residual car values drop, the cost of leasing must increase to account for the lower residual value. That, in turn, makes leasing a relatively less compelling option.
Used cars drive the entire automotive value chain, as their prices determine both lease rates and how relatively appealing new cars are at their current prices. Around 2/3 of consumer automobile purchases are used vehicles.
The used car market already represents a far greater share of auto purchases than new cars. About 40 million used vehicles were sold in the U.S. in 2017. That is more than twice the 17.2 million new cars sold, which was itself nearly a record number.
Automobiles have large, complex & global supply chains. The threat of the United States increasing trade tariffs against China drove up used car values in the summer of 2018.
Localized weather issues like hurricanes can drive significant changes in supply & demand for both new & used vehicles.
Visualizing Depreciation
Here is a table which highlights the hypothetical depreciation of a typical $30,000 car, though actual rates of depreciation vary by make & model. For a more precise guide, you can look up what various used cars are listed for in the Kelley Blue Book or what they have recently sold for on a marketplace listing service which displays recent prices like TrueCar.
| Condition | Depreciation this Time Period | Total Depreciation | % Depreciation from Prior Value | % Depreciation from Purchase Price | Total Depreciation % | Ending Value |
|---|---|---|---|---|---|---|
| Brand New | $0 | $0 | 0% | 0% | 0% | $30,000 |
| Driven Off Lot | $3,339 | $3,339 | 11.13% | 11.13% | 11.13% | $26,661 |
| First Year (after lot) | $4,080 | $7,419 | 15.30% | 13.60% | 24.73% | $22,581 |
| Second Year | $3,399 | $10,818 | 15.05% | 11.33% | 36.06% | $19,182 |
| Third Year | $2,991 | $13,809 | 15.59% | 9.97% | 46.03% | $16,191 |
| Fourth Year | $2,649 | $16,458 | 16.36% | 8.83% | 54.86% | $13,542 |
| Fifth Year | $2,379 | $18,837 | 17.57% | 7.93% | 62.79% | $11,163 |
Here are the IRS passenger automobile depreciation deduction limits from Publication 946.
| Date Placed in Service | 1st Year | 2nd Year | 3rd Year | 4th & Later Years |
|---|---|---|---|---|
| 2016 | $11,160 | $5,100 | $3,050 | $1,875 |
| 2015 | $11,160 | $5,100 | $3,050 | $1,875 |
| 2014 | $11,160 | $5,100 | $3,050 | $1,875 |
| 2013 | $11,160 | $5,100 | $3,050 | $1,875 |
| 2012 | $11,160 | $5,100 | $3,050 | $1,875 |
| 2011 | $11,060 | $4,900 | $2,950 | $1,775 |
| 2010 | $11,060 | $4,900 | $2,950 | $1,775 |
| 2009 | $10,960 | $4,800 | $2,850 | $1,775 |
| 2008 | $10,960 | $4,800 | $2,850 | $1,775 |
| 2007 | $3,060 | $4,900 | $2,850 | $1,775 |
| 2006 | $2,960 | $4,800 | $2,850 | $1,775 |
| 2005 | $2,960 | $4,700 | $2,850 | $1,675 |
